I’ve been working on a small language model for a project, and it’s a very nice demonstration of how we can hide bias behind parameters, so I decided to do a little statistical analysis for a demonstration of how dramatic these things can be.
But first, let me briefly recap where the problem is.
A language model, the way I’m using it, generates characters one at a time, and remembers some context from previous characters, so that meaningful strings are created one letter at a time. Internally, they usually use an embeddings layer, a few layers of a recurrent network, and then an output layer. What the output layer does is generate for each character that we see, a set of scores for the next character.
In the very simplest case, we can simply pick the top score for the next character, but that doesn’t work out all that well. A better strategy is to use a probabilistic choice according to the score, so we are more likely to pick the top one, but rarer ones are still possible.
The problem is, when we are generating literally millions of characters, some of these rare options become effectively inevitable, and we can get a few rare occurrences of strange language. That also isn’t particularly good. So we want a way to adjust our selection to reduce the likelihood of a stupid character showing up, but not to the point that the generation is jammed into very simplistic text.
The usual approach is to use three different parameters:
- Temperature – a factor that modifies the score before we make any probabilistic choice. A temperature below 1 tends to accentuate the probabilities, making the choice more (small-“c”) conservative. In other words, we are less likely to pick rarer options. A value of 1 means the scores are not modified at all.
- Top k – after applying a temperature factor, we can also restrict the number of options. So, if we use a top-k of, say, 10, then we make a probabilistic choice between the top 10. A top-k of one means we only ever pick the single top ranked choice.
- Top p – after applying both of these, we can then use a probability threshold. So, for example, if we use a top-p of, say 0.9, then characters in the rarest 10% of next possibilities are rejected out of hand. It’s a little more flexible than top-k, because it’s better at reducing options when there are a few likely characters and plenty of terrible ones. In practice, both are useful.
Note that what these do, all of them, is skew the choice of next characters so that rarer possibilities from training may happen much more rarely, if at all. This is bias.
In this case, the model I’m using generates people’s (full) names. There’s a small-ish training set, It’s all unsupervised, and the data is quite carefully curated. However, there is bias in there, as a natural consequence of the source of the data. For example, “John” is a pretty common name, and unsurprisingly, it’s common in the training set. On the other hand, “Anastasia” is a much rarer name. So, by default, we’d expect to see more Johns than Anastasias in the output.
In fact, in our training set, there are Johns make up about 3.4% of all names, and Anastasias make up around 0.005%, so the differences are significant.
A second measure worth looking at is the number of “Fuck”s. The “F word” doesn’t occur anywhere in the training set (I promise). However, this is a character-based language model, and “F” followed by a “u” isn’t all that unusual, or a “u” followed by a “c”, and so on. So, given a few probabilistic transitions, it’s definitely possible to get a “Fuck” from time to time. In practice, many more Fucks are given than you might expect. (And if you think this is bad, remember that this is also true for any racist epithet – just because they aren’t in your training set, does not mean they won’t get generated. Filtering the output is important, folks.)
I could have gone into gender issues more, but the percentage of Johns is a pretty good proxy, certainly simpler than handling gender neutral names, which are simply horrible and invalid to classify anyway, as names often aren’t gendered anyway.
Intriguingly, since the data also generates multiple first names – these are part of our training set – the model will happily generate and combine names, so in our samples we get some wonderfully evocative names like “Mark Jayne Shelley” and “Sarah Joseph Francis Daliori”.
Anyway, that’s the baseline in the training set. Let’s see what happens when we start to adjust our parameters. To measure these, I generated 100000 names with each setting, and count the number of Johns.
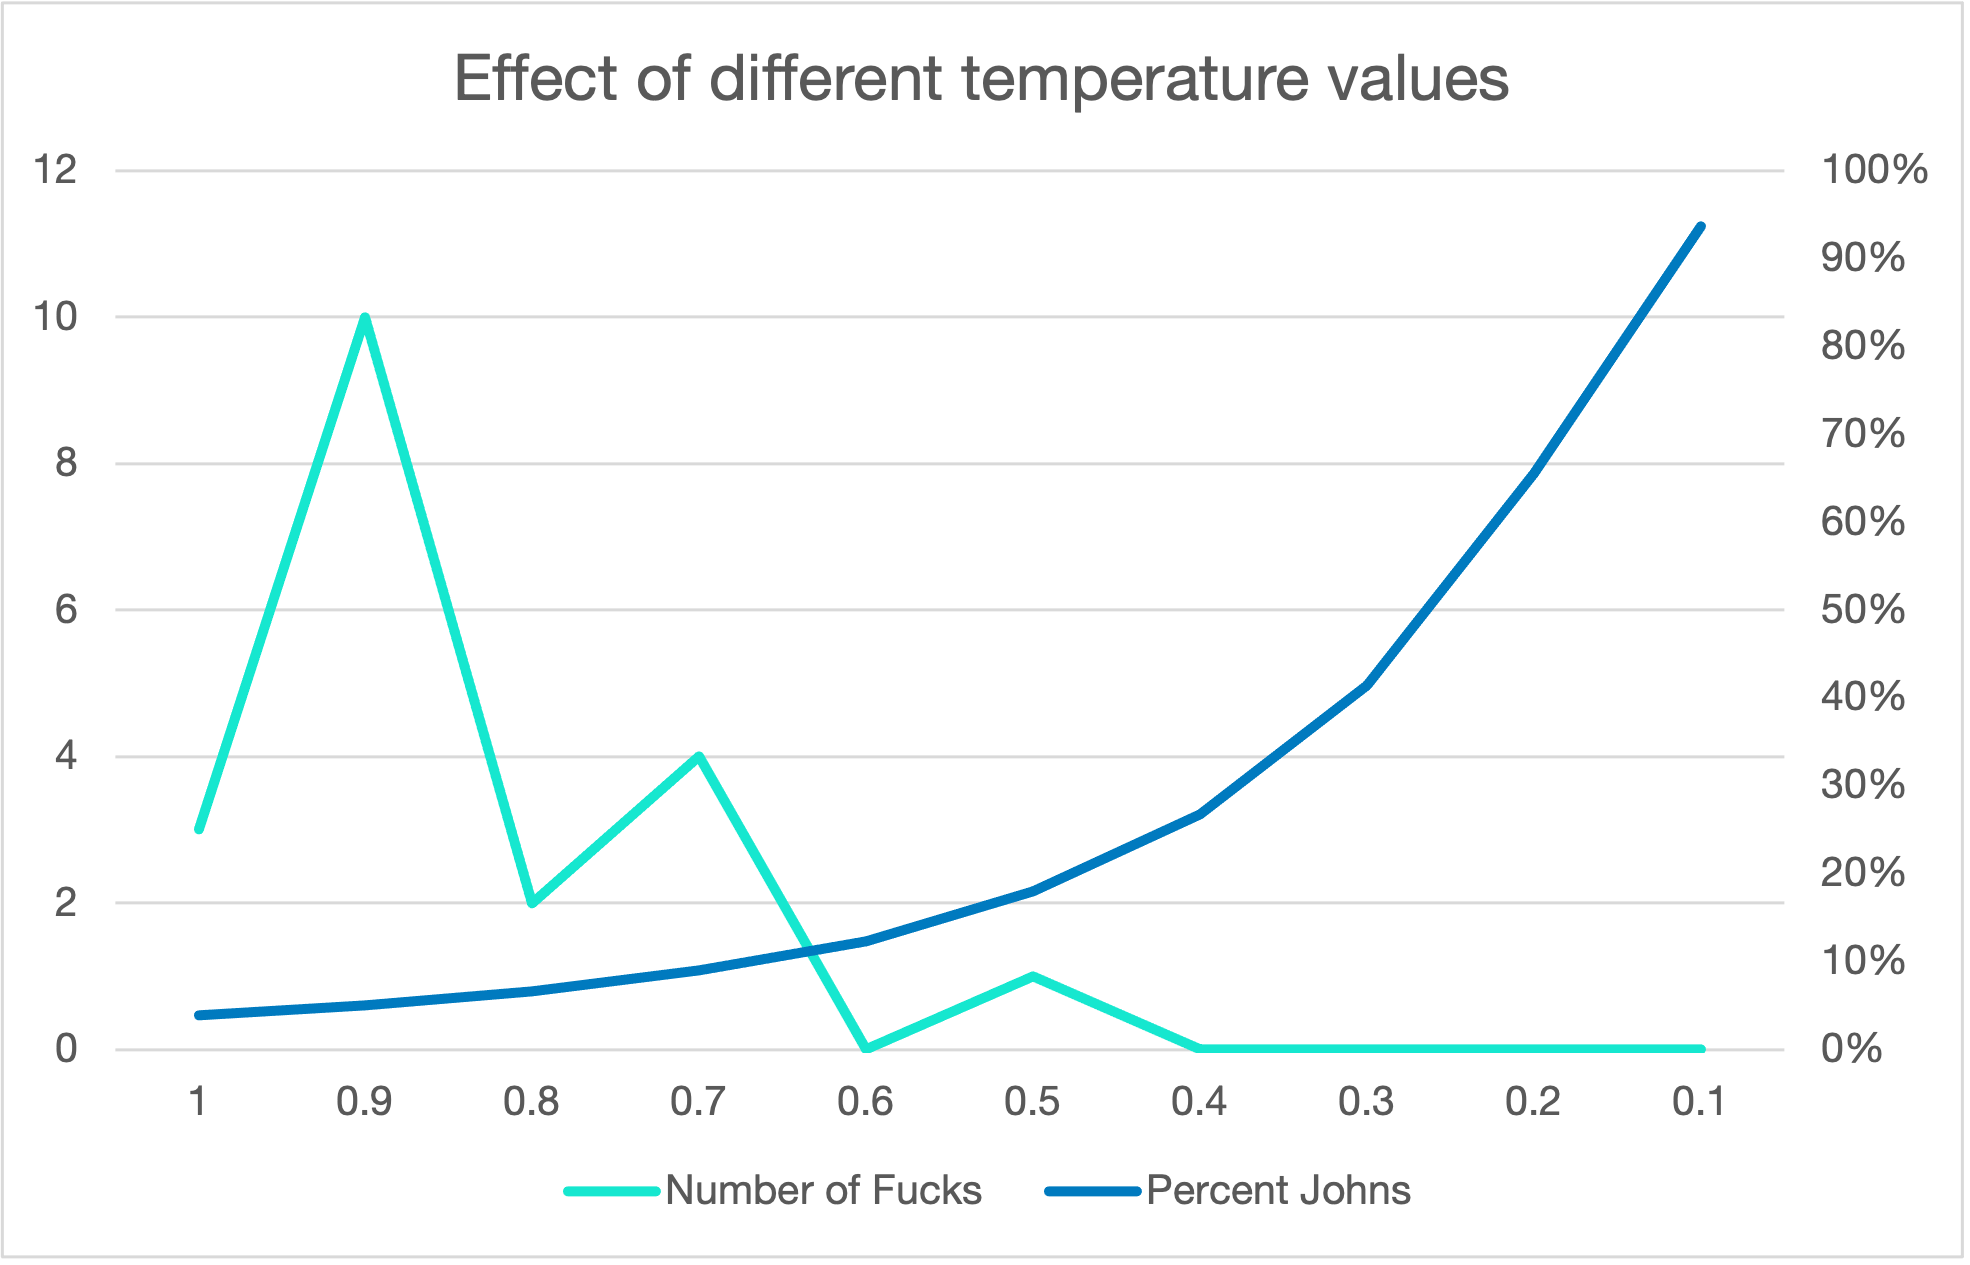
We can observe several trends from this. First, for minimal values (i.e., temerature and top-p of 1.0, and unlimited top-k – all of which should have no effect) the percentage of John’s is around 3.8% – very close to, but still a shade higher than, the prevalence in the training data.
Next, we can see temperature very quickly increases bias, and not in a small way. Even a subtle shift from 1.0 to 0.9 makes about a 50% increase in the number of Johns. If we wanted the generated results to be representative of a population, this would be a serious issue. By the time temperature gets to 0.1, virtually every single generated name is a John. They’re all Johns.

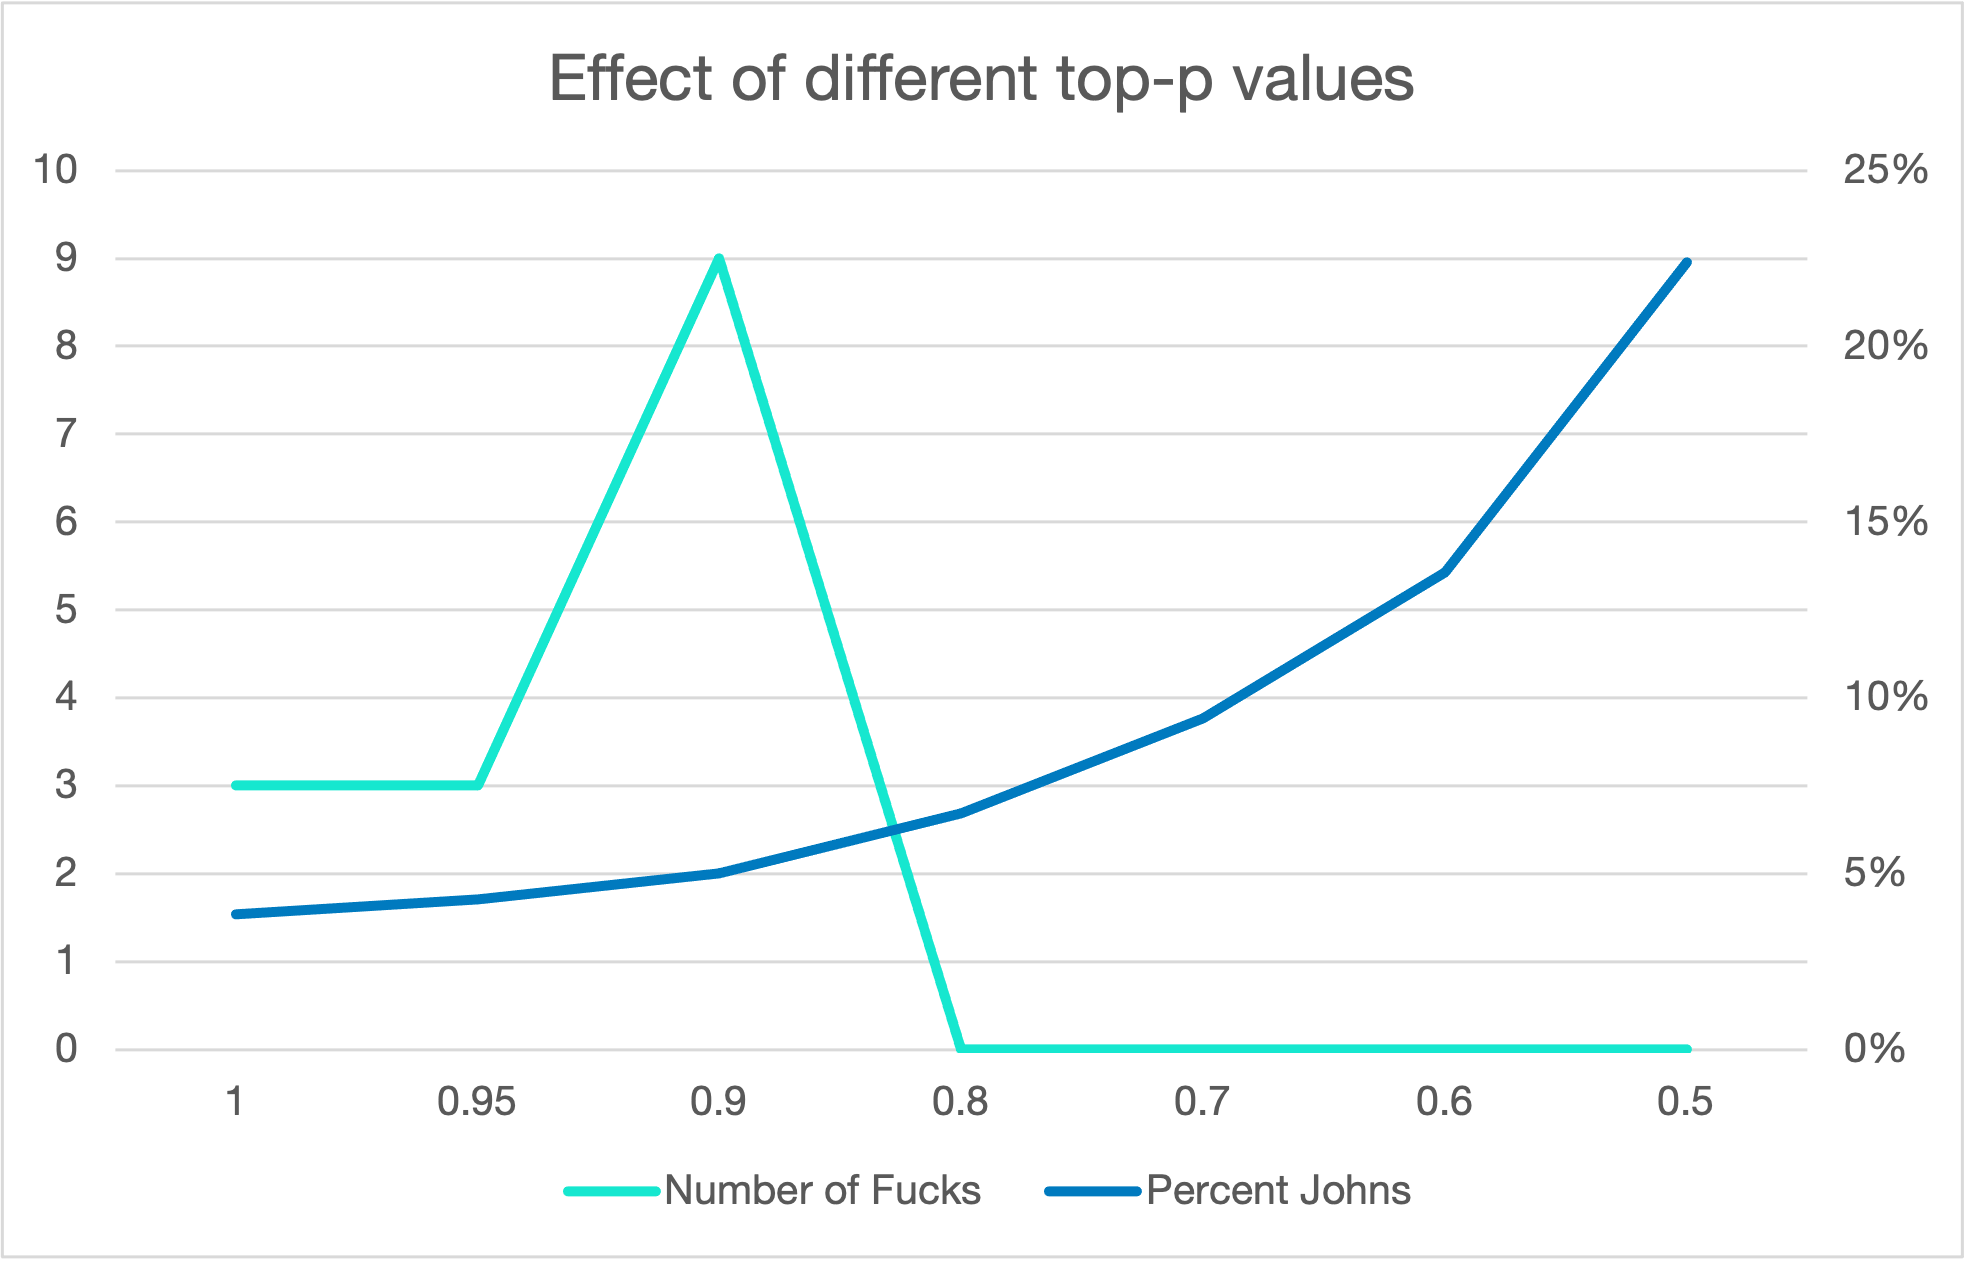
And there’s a similar effect for top-p.
And here I’ve focused on the first names, but the effect is a universal reduction in diversity. In the limit, we get every name generated being the same: “John Stevenson”. The proportion of Johns is a decent, although rough, proxy for diversity in the names generated.
Finally, there were rather more Fucks than I expected, but it’s still relatively rare, at around 0.001% of names, even at a maximum. Some of the more spectacular ones include: “Elizabeth Fucker”, “Christian Fuckland”, “D. John Fuckan”, and the truly wonderful “Jimmy Adams Crappard Fuckling”. (I think I once saw them live in Newcastle, Crappard Fuckling, one of the better mid 70s pub rock bands of the area.)
But, interestingly, the number of Fucks also depends on temperature, in almost the opposite way. There is a peak of Fucks given at around 0.9, and as the temperature lowers the Fucks get drowned out by the Johns.
What these parameters do, in effect, is increase the preference for typicality, sharpening the distribution. To an extent, that may be a good thing, especially for a small model or training set. But you need to accept that, right from the very start, these parameters increase the prevalence of typical values, and start to remove the atypical ones. Fucks aren’t highly typical, so a small pull towards typically can make them a little more frequent, but a larger tendency towards typicality reduces them again, as everything becomes John.
And that is how adjusting temperature, top k, and top p, increase the bias in your AI application. It’s hardly rocket science, after all, the temperature literally and directly affects the probability of character choices. However, note that this is a character-by-character model, with no supervision. And yet, from that, we get our stereotypical names becoming dramatically more frequent.